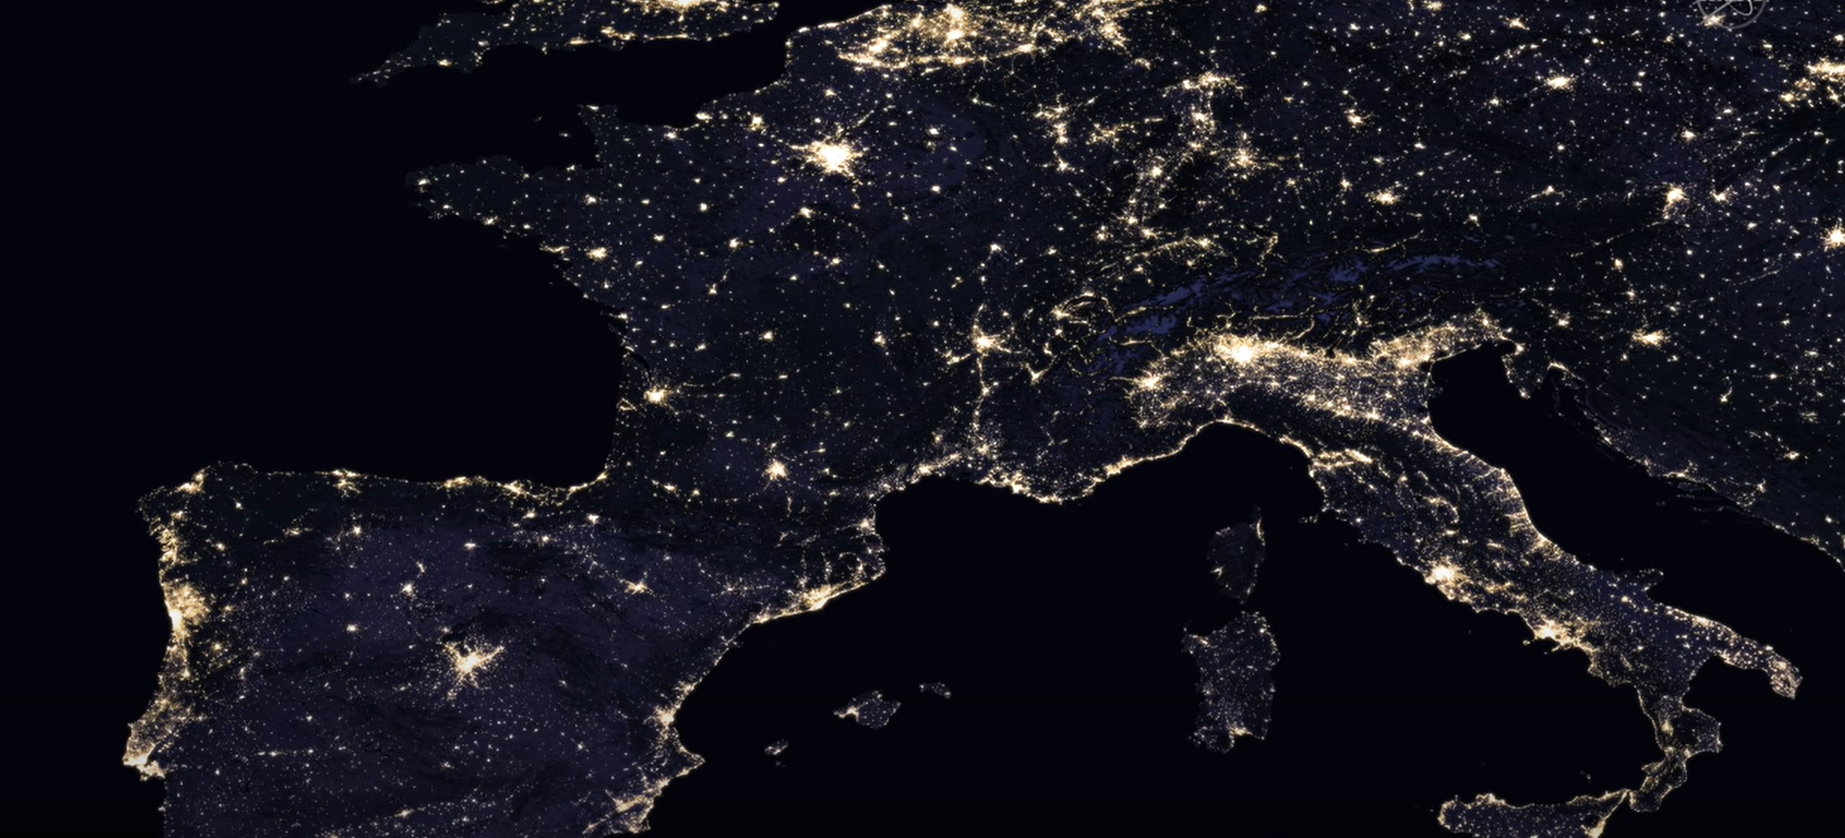
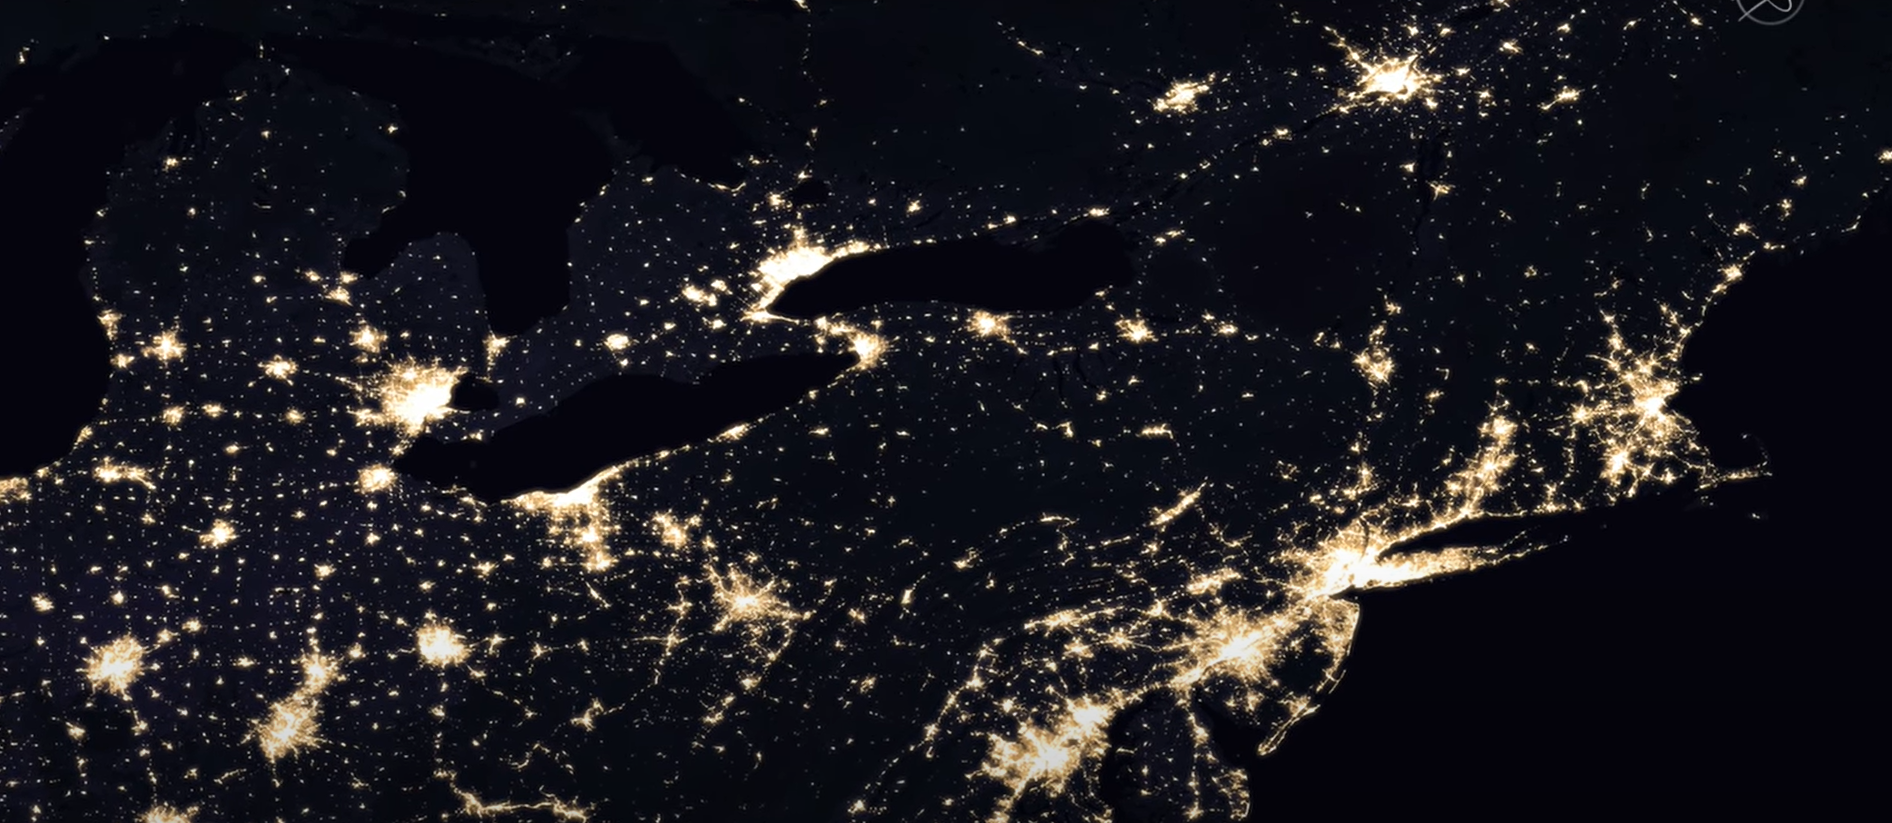
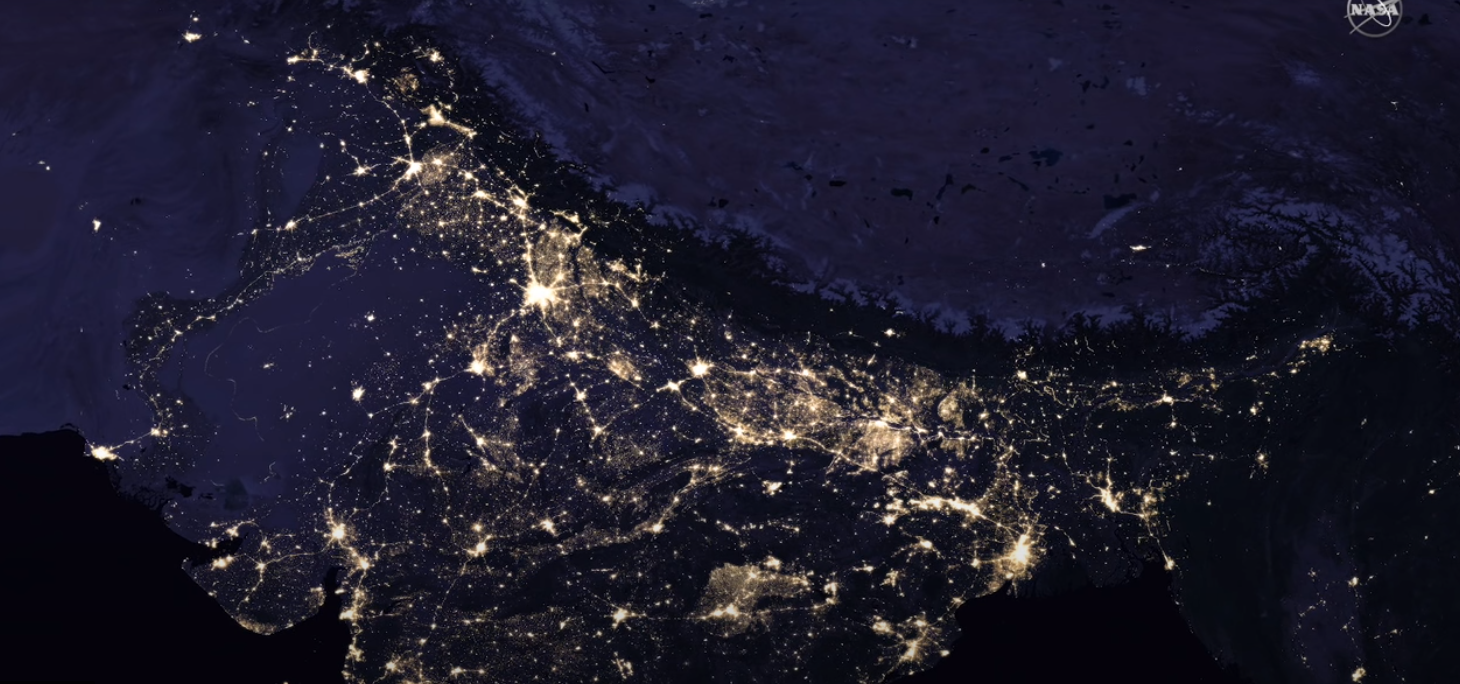
The other day I stumbled upon NASA’s Black Marble map, which are effectively satellite images of the Earth at night that capture artificial lighting. The aim of this imagery is to better understand impacts of light pollution, illegal fishing, fires, disaster impacts and recovery, and human settlements and associated energy infrastructures.
I thought I’d share some cool imagery/maps by the satellite below:
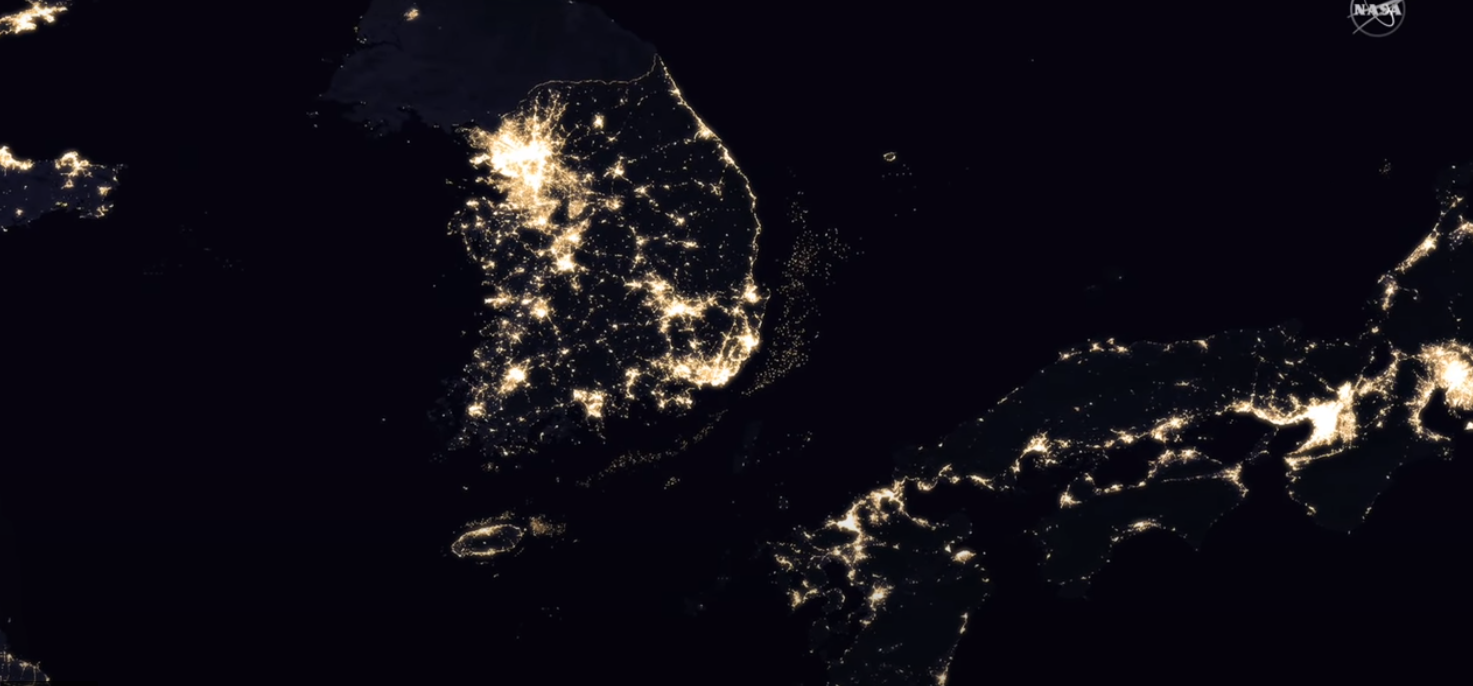
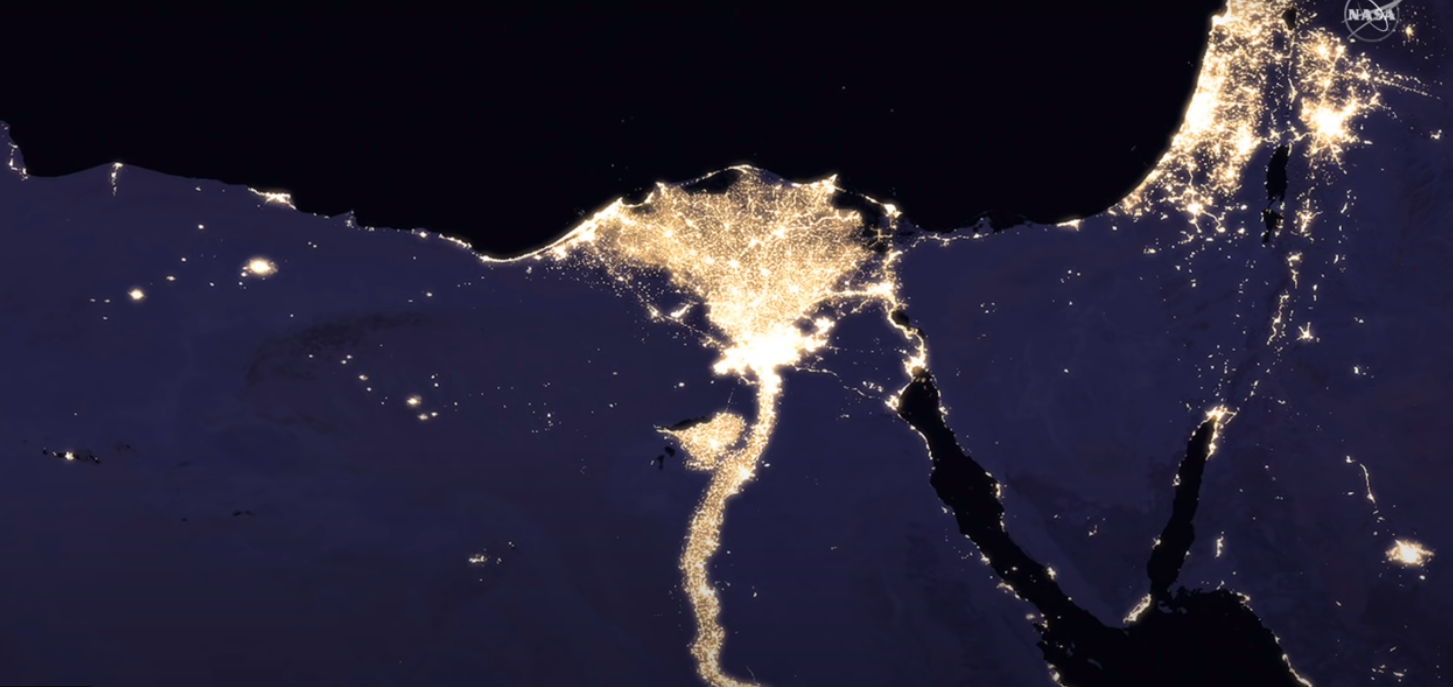
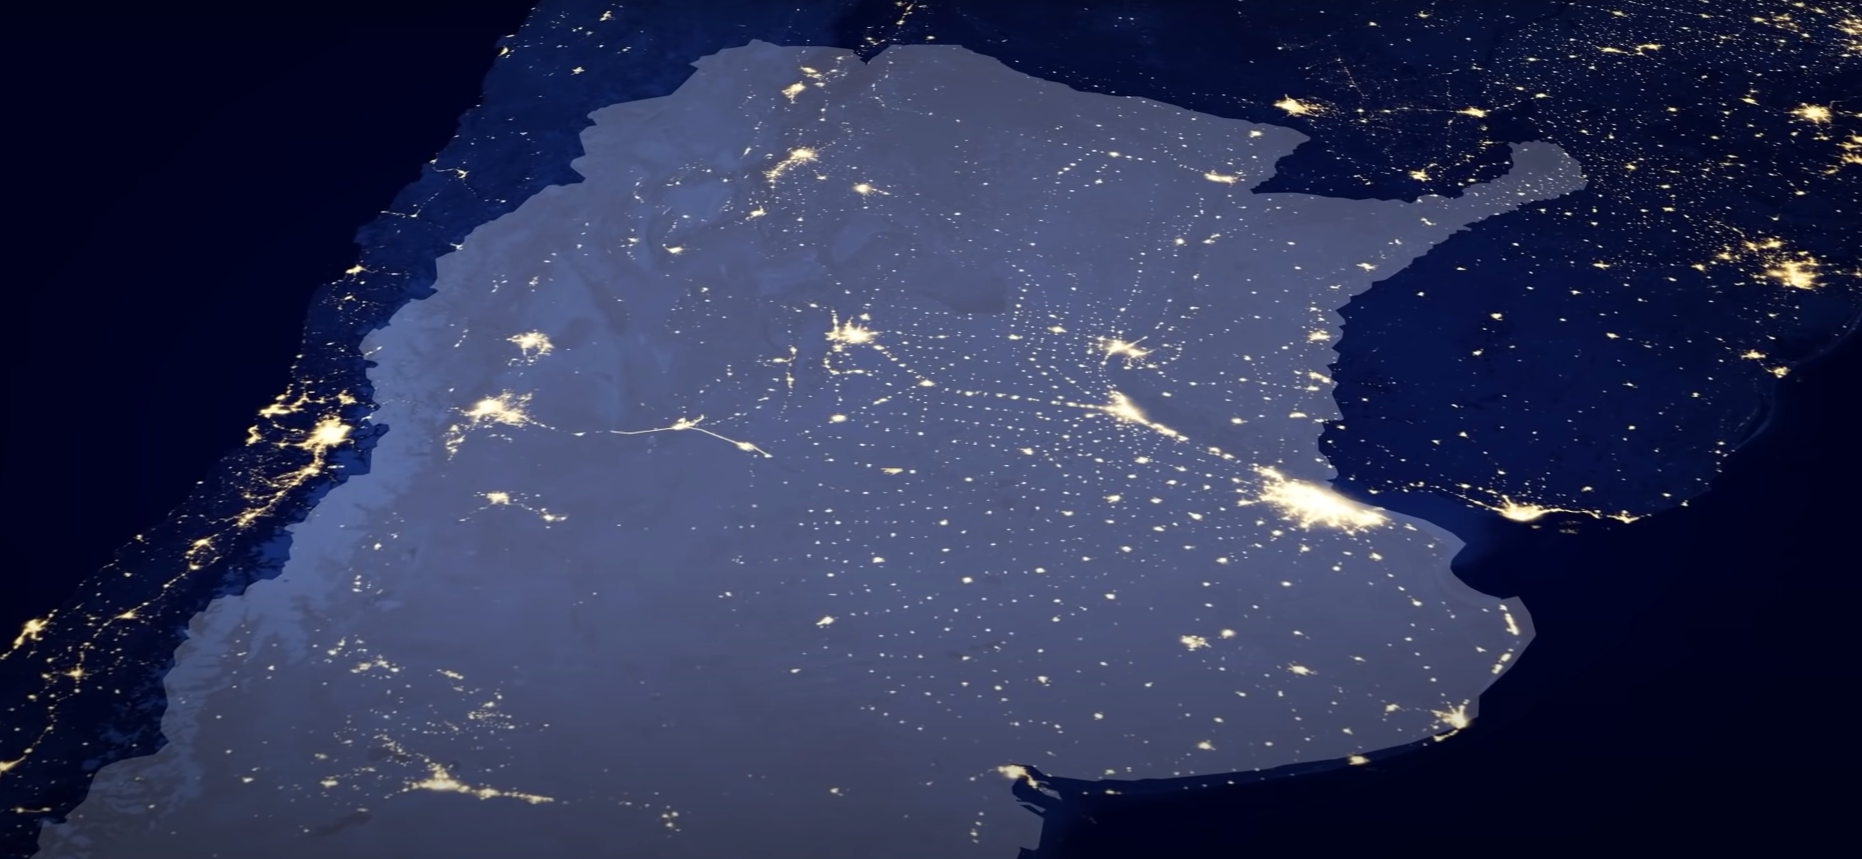
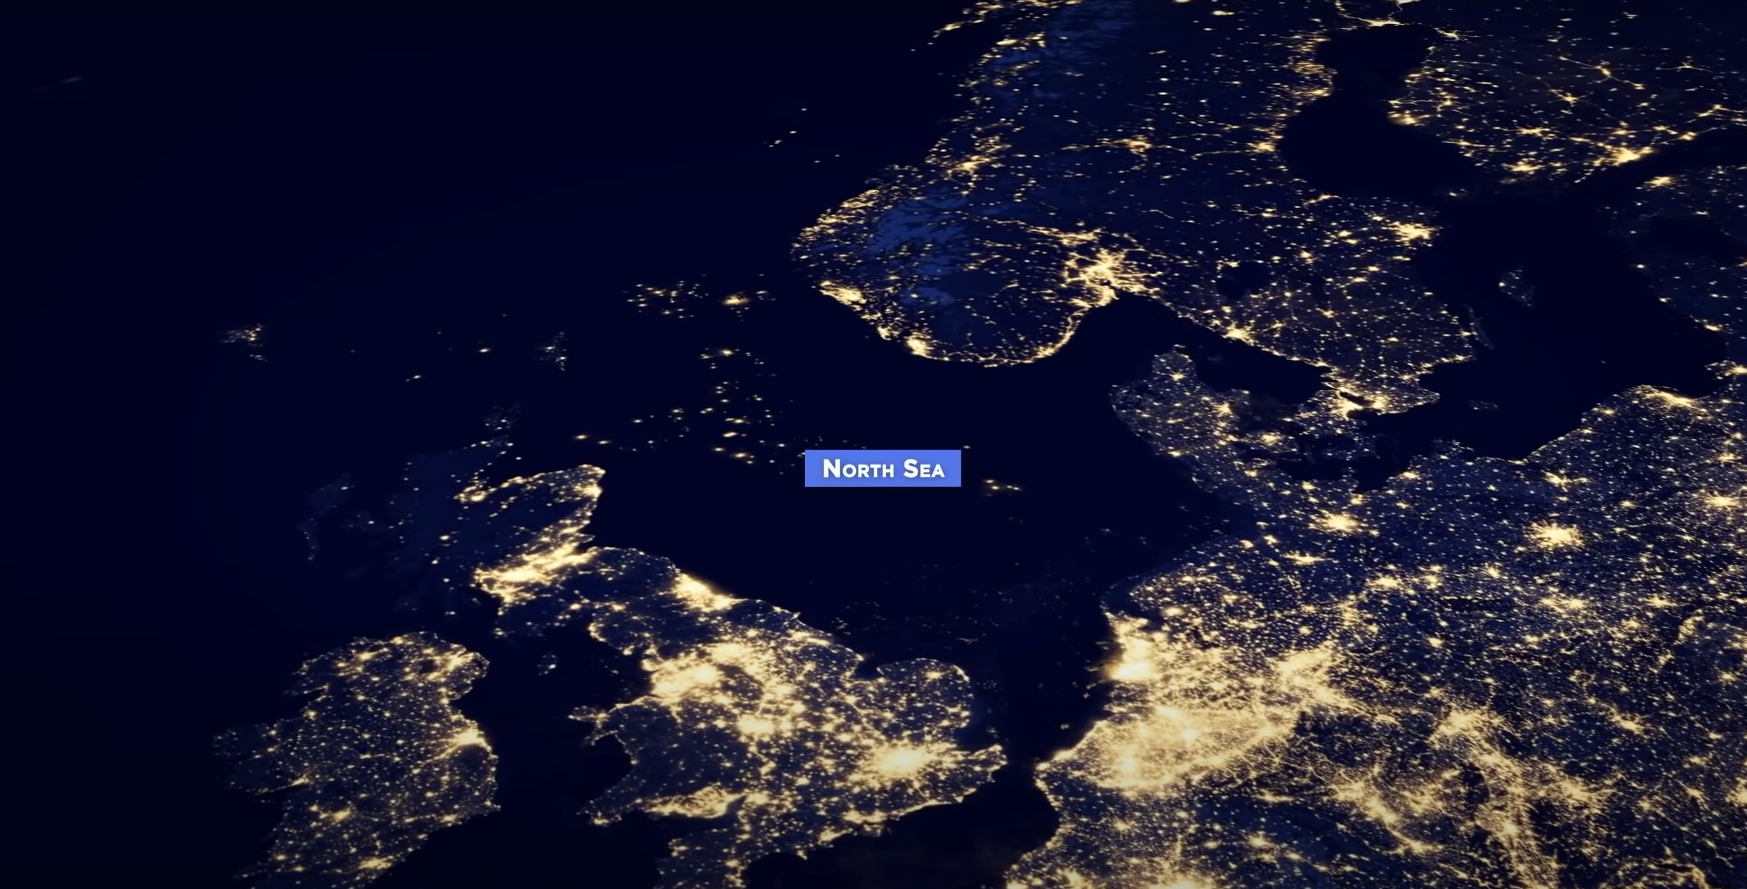
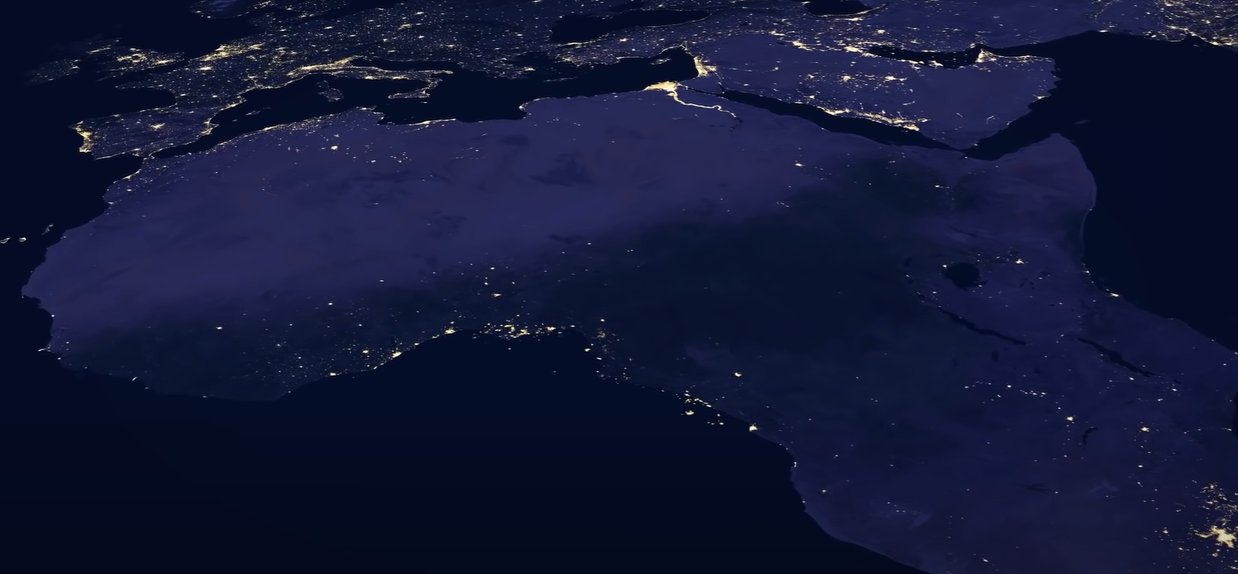
Southwestern EuropeNortheast USA/CanadaNorth and South Korea and Southern JapanCairo and the Nile + IsraelThe USAPakistan and Northern IndiaArgentina The North SeaPersian GulfAfrica
There are numerous fascinating phenomenon’s you can clearly make out by viewing these images/maps:
How well lit the borders are between Pakistan and India, and North and South Korea
The difference in intensity of lighting between places like North and South Korea
The 100th Meridian West in the US – this meridian roughly marks the boundary between the dry (semi-arid) climate in the west and the humid continental and subtropical climates in the east. It explains the sparsely populated western part of the US due to the need for heavy irrigation to support agriculture
Afghanistan’s ring road cities that encircle it’s mountainous and craggy interior – similar situation with Iceland and Australia where the vast majority of its cities/towns are located along the coast
Perth in Australia is the most isolated big city in the world
All those oil rigs in the North Sea, or better yet, the Persian Gulf
The sheer presence of people living along the Nile and Indus Rivers
Argentina’s perfectly spaced and organized rail road towns
If you are able to compare the Black Marble Maps from previous years, you can see some dramatic changes in the following places:
The detrimental impact of the Syrian Civil War (+ISIS/ISIL) on electricity output in Syria and northern parts of Iraq
The increasing intensity of India’s lights – ensuring electricity reaches every village in the Country was a central issue of Modi’s party platform
The massive urbanization (rural to urban shift) of China
Sub-Saharan Africa appears far darker than it should be – not because there is no one living there, but because there are over 600 million people there without access to electricity. Many of the people still rely on solid fuels like wood for heating and light, and thus their presence is not captured by NASA
For more information, you can also explore Google Earth in “night mode” (which allows you to go back in time and compare), and there’s a great video on YouTube that identifies some of the most interesting patterns made by the lights.
A few weeks ago I watched a very interesting BBC documentary about the history of Russia called – Empire of the Tsars. The documentary speaks of a fascinating period where Russia was reinvented and transformed from a largely rural and insular country to a major global power. In particular, the documentary focuses on the Romanovs – a Russian royal family lineage that lasted 300 years – and primarily the lives and achievements of Peter and Catherine the Great.
Peter the Great had big political ambitions for Russia that were shaped by the time he spent in western Europe and particularly the Netherlands during his 20s. When he returned to Russia, he implemented sweeping reforms aimed at modernizing the country from introducing social measures such as western dress codes and a tax on beards (yes, you read that correctly), to the industrialization of the resource economy and establishment of a navy. Peter’s early passion for shipbuilding and sailing and his lifelong dream of a Russian maritime power seemed to converge nicely over inhospitable swamp and marshlands near the mouth of the Baltic Sea. This strategically located swamp along the banks of the Neva River, which belonged to the Swedes at the time (late 1600s) would become St. Petersburg. The city was spawned through Peter’s adamant and persistent will, who not only needed a window to Europe and warm-water port to realize his dream of a navy power, but was also staunchly determined to turn his new City into the Cultural Capital of Russia.
The city was built by tens of thousands of serfs, convicts and prisoners of war (Peter ordering an alleged conscription of 40,000 serfs annually), who had to provide their own tools and food for the journey of hundreds of kilometres on foot. The serfs were in groups, often escorted by military guards and shackled to prevent escape. Tens of thousands of workers died building the city from disease, starvation, frequent flooding and exposure to harsh conditions. Often times the workers had no tools and dug by hand and carried the dirt in the front of their shirts. It is due to the heavy casualties suffered creating St. Petersburg that it became known as the City Built on Bones. Just imagine being forced out of your home to go help build a city hundreds of kilometres away at the whims of your current leader, with nothing provided, and on top of it all – you had to build it on a swamp.
Peter’s time in Western Europe shaped the urban fabric of St. Petersburg. He hired engineers, architects and businessmen from across Europe to help drain the marshland and sink trees into the swamp in order to support foundations, and design a city vastly different from Russian cities at the time which grew organically. Peter also outlined three key rules/guides for St. Petersburg:
buildings must be constructed next to each other with their faces along a “red line” (i.e., creation of a streetwall and frontages)
streets must be straight, not curved (i.e., creation of a grid system)
everything must be built of stone
In fact, the need for stone was so great that Peter restricted the construction of stone buildings throughout the rest of Russia and ordered all stonemasons to help build the new city. And what you can see in Peter’s three rules was an attempt to sterilize the city (not too different from what Paris, Barcelona, Lisbon or even Brasilia experienced), but starting from scratch. These rules were so influential in fact that Catherine the Great ordered 160 cities across Russia to implement similar design approaches.
In 1712 Peter moved the capital from Moscow to St. Petersburg, which remained the capital for just over 200 years until the Bolshevik Revolution. In 1917, Lenin reverted the capital back to Moscow and started the Russian Revolution.
Over those 200 years as a capital, several key figures such as Empress Elisabeth, Catherine the Great, and Alexander the 1st, 2nd and 3rd would completely transform St. Petersburg from a small port on the Baltic to a major European capital renowned for its opulent palaces, awe-inspiring churches, and as the centre of the Russian Golden Age in artistic, literary and musical talent. Initially, people and key state figures were ordered to move to St. Petersburg to help populate the area (remember – it was made a capital by Peter). But over time, they began coming on their own accord and the growing number of diverse immigrants eventually turned St. Petersburg into a much more cosmopolitan city than Moscow and the rest of Russia. Famous individuals like Aleksandr Pushkin, Nikolai Gogol, Pyotr Tchaikovsky, Ilya Repin, Fyodor Dostoyevsky and numerous others called St. Petersburg their home. Today the City is the 2nd largest in Russia, is recognized as the Cultural Capital of the Country, and plays a key economic, scientific, cultural, and touristic role on an international scale.
It is simply incredible that the foresight and vision Peter the Great had for St. Petersburg had finally arrived, and yet he never got to see it.
Fyodor Dostoyevsky famously wrote – “[St. Petersburg is the] most abstract and intentional city in the whole world”
The Peterhof Palace and the Grand Cascade fountain
A few months ago I read a fascinating article from Harvard University on Ildefons Cerdà’s 1860 Plan for the Urban Expansion of Barcelona, and specifically, how and why it was conceived in such a unique way.
If you have ever been to Barcelona, or looked at a satellite image of the city, or recently heard about their new Superblock initiative, you are probably aware of the Eixample neighbourhood in the City. It looks like this –
Those beloved and revolutionary blocks, as well as the detailed design behind them was engineered by Ildefons Cerdà in the late 19th century. The high mortality rates of the working‑class population and poor health and education conditions during the early and mid 1800s pushed Cerdà to design a new type of city, in which his main objectives were to obtain a high degree of wellbeing for the population through rational housing conditions and provision of services.
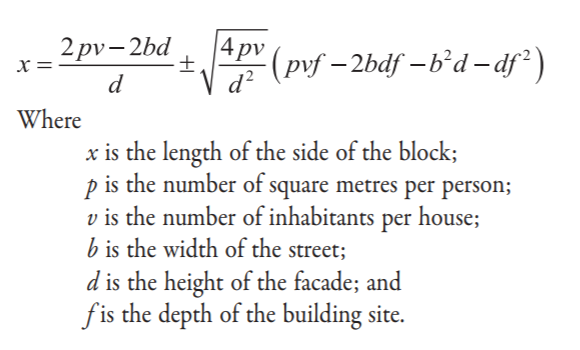
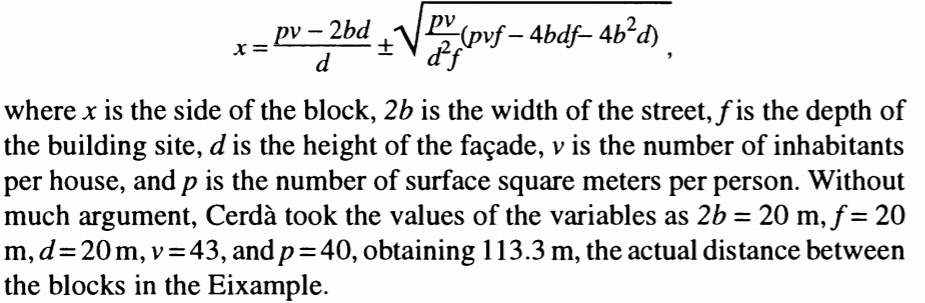
What stood out in the Harvard article published in 2011 for me was a formula that the authors identify Cerdà used to arrive at the ideal length/width of the blocks themselves –
My obsession over cities, math, design and planning seemed to converge perfectly here, and I decided to test out the formula myself. Below are some explanations from Cerdà on the variables and assumptions he used and how he arrived at them:
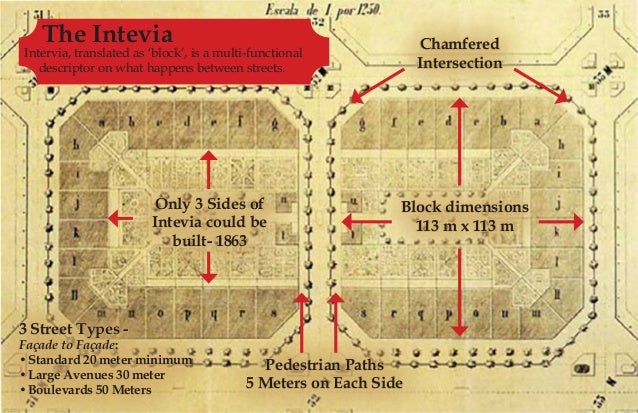
Three of his main concepts were used to determine the side length of the blocks (113 metres):
the number of square metres per person
the number of inhabitants per house, and
the width of streets
His aim was to achieve optimal living standards of 6 cubic metres per person and room, and 40 square metres per person in housing: “Nowadays, one would need 6 cubic metres of atmospheric air per person and per hour in order to breathe correctly. Scientific studies establish a minimum of 40 square metres per person within towns” (Cerdà 1859)
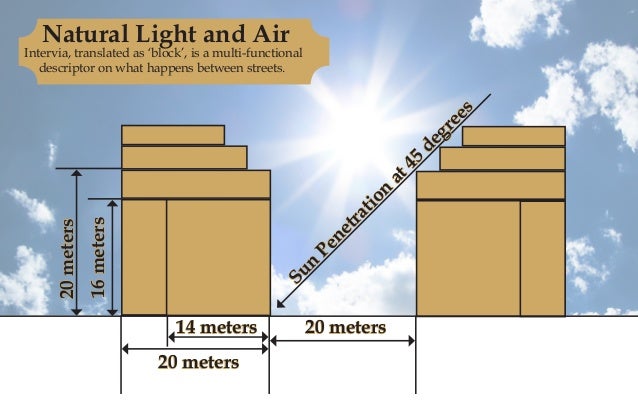
In the end, the blocks measured 113m x 113m, while street widths ranged from 20 to 30 m, with 50m for wide boulevards (and 5m for sidewalks). Buildings on each block were about 10 to 20m deep with yards and green spaces in between each block, intertwined with pedestrian paths that linked the inner open spaces together independent of the street network. Furthermore, the corners of each block were cut at 45° angles (chamfered) and made 20 metres long to create small squares between the octagonal blocks. Heights of the building podiums were also limited to 20m to allow for sun penetration at an angular plane of 45°.
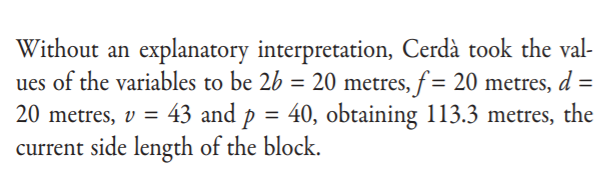
It is simply unbelievable how these “standardized” urban planning principles formulated by Cerdà (and others) from 150 years ago we still apply in our cities today. But what may be more unbelievable is that the formula and its explanation are incorrect! Yes I just said that about an article published from Harvard.
After plugging in the variables in the formula, my answer was nowhere near the 113m. I researched other articles and found one (from the Universities of Barcelona and Maastricht published in 1997) referencing a different formula. In fact, the 1997 article is a source in the 2011 Harvard article.
Below is the formula shown in the Barcelona and Maastricht Universities 1997 article:
I plugged in the variables in this formula and still was not getting the desired result, but it did get me closer to the 113m than the previous formula.
And then I read this:
“Few people in Barcelona know that this formula accounts for one of the most important features of the city. Still, no one knows where it comes from. Cerda did not write a single word to explain or clarify its meaning. It can be interpreted as a rhetorical device to black-box a particular technical detail, by appealing to the scientific and objective character associated with mathematical representation.”
Ok that was not the most promising thing to read – that the key principles responsible for much of Barcelona’s highly regarded and globally recognized urban fabric, of which many have been adopted by cities around the world, are based off a black-box of a formula.
But I did not stop there – I told my parents about this over lunch a few weeks back and my dad decided to help me unpack this formula (he is a civil engineer, so his math skills are certainly above mine), and he solved it! What we found out was that the formula actually checks out (whether it makes sense however is a topic for another discussion), and the issue lies in the presentation of the variables (and an incorrect formula in the 2011 Harvard article). Understandably, these academics were working with century old documents, so we can sympathize with them.
So our findings are as follows:
the formula in the 2011 Harvard article is incorrect
the formula in the 1997 University of Barcelona and Maastricht article is correct
b = 10 (2b is not a variable; b is the variable)
once you use b as 10, your answer is 113.28m
The system works.
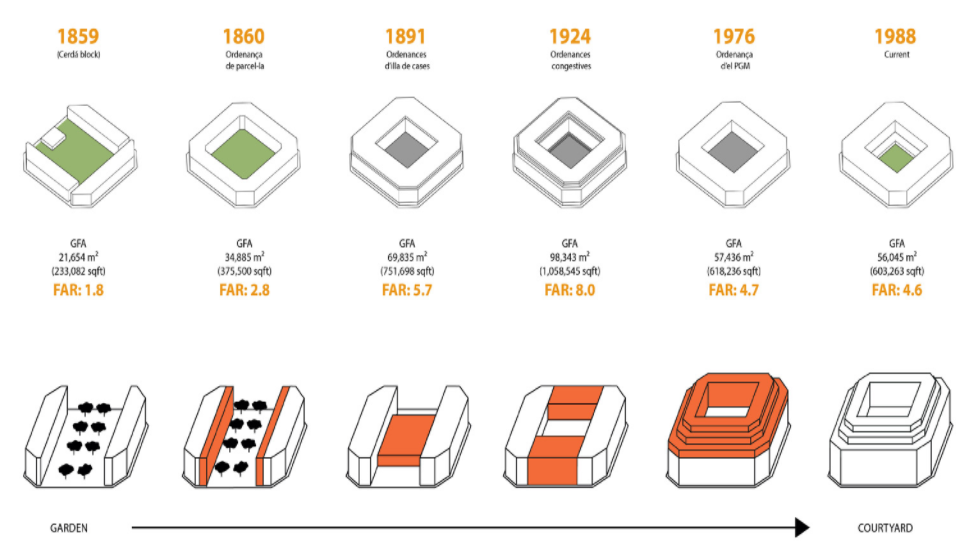
Aside from the formula, the articles themselves are quite fascinating as they not only outline the approach and thinking Cerdà (and others) applied to design and shape the blocks (and the rest of the city), but the history behind it all, how key services would be accessed by the residents, and ultimately whether the vision for the City was achieved. (Spoiler alert – Apparently not, as economic pressures forced densification of the blocks beyond what Cerdàanticipated. As early as 1890, buildings occupied 70% of the block area on average, instead of the original 50%. In 1958 the building volume of the block, which according to Cerdà’s bylaws should not have exceeded 67,000 cubic metres, reached 295,000 cubic metres).
If you enjoy learning about the history of cities, planning and public works, I definitely recommend reading the two academic articles referenced in this post and the others shown below: