The other day, the Toronto Real Estate Board released their resale housing market data for the month of December (2017). 2017 was a crazy year for Greater Toronto Area (GTA) housing prices. Ontario’s Fair Housing Plan, which was introduced in April had quite an influence on the resale and new home sale markets.
If we were to look at resale house prices annually from 1953, this is what they look like ( shown in the chart are the average house prices for 2017, 1989 and 1974) –

This is what the annual % change in house prices since 1953 looks like (shown in the chart are the annual % changes in prices between 2016 and 2017, 1991 and 1992, 1986 and 1987, 1980 and 1981, 1973 and 1974, and 1965 and 1966) –
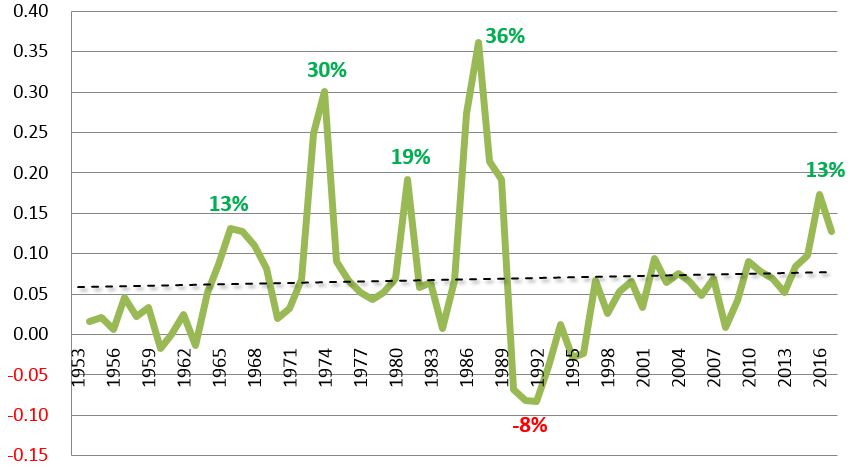
Despite the ups and downs of the 2017 resale housing market, prices for the year are about 13% higher than resale prices in 2016.
This is what median house prices look like for every month since 1996 –
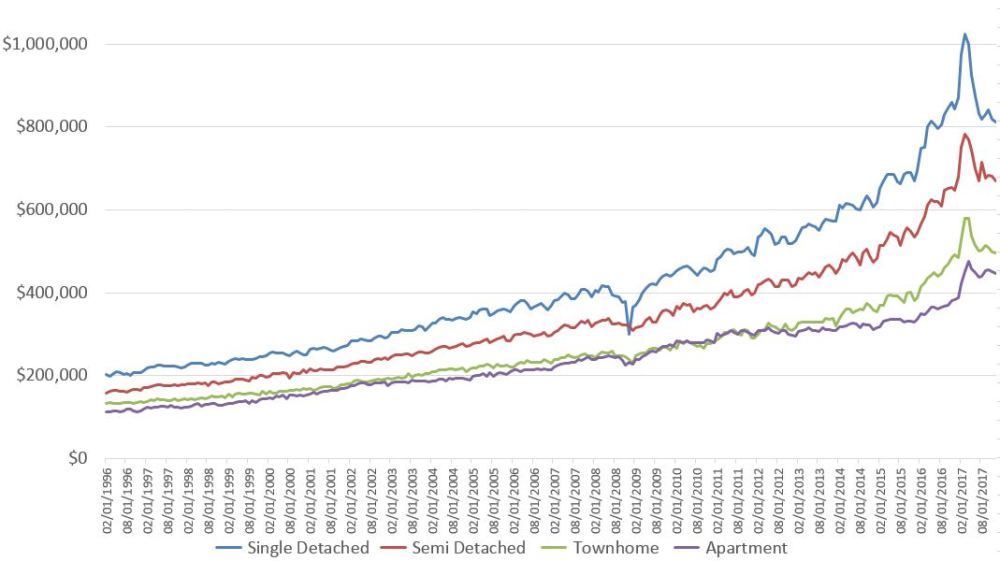
We can see the big run up in prices during 2016 and the early months of 2017, followed by a fairly steep drop after Ontario’s Fair Housing Plan release.
And the following chart shows the Year over Year (YoY) changes in monthly house prices since 1997 –
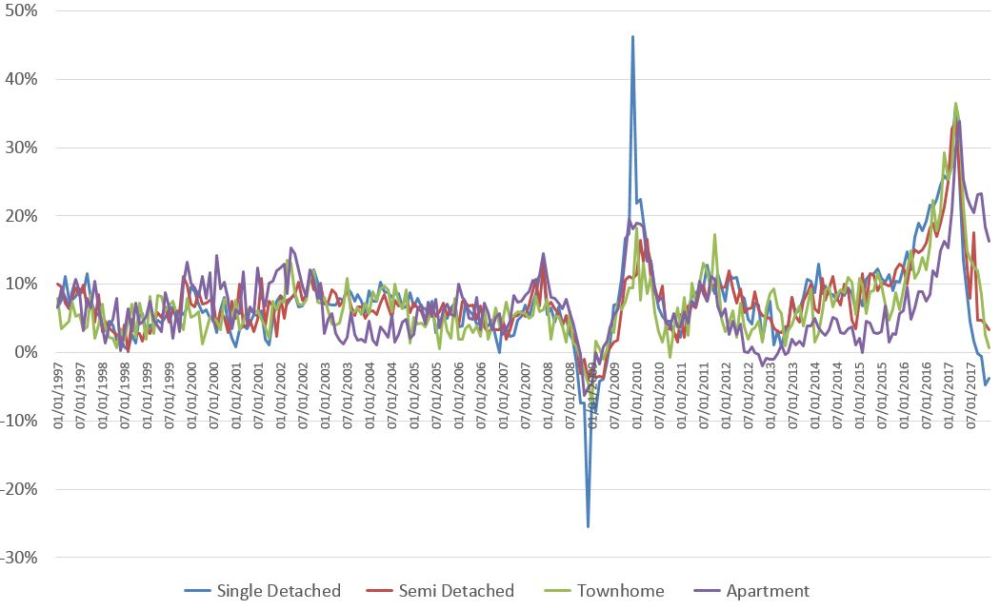
What I pick up from the YoY chart immediately above is that Toronto GTA’s house prices increase on average between 5 to 10% per year – which can be considered a very reasonable growth rate for a region that grew by about 2 million people and added over 1 million jobs over the last 20 years. But beginning in 2016, there was significant upward pressure on prices – in March of 2017 for example, prices were up 34% YoY! And the precipitous drop that followed was not something that was unexpected. The last time our house prices experienced these kinds of swings was during the great recession of 2008 (as clearly evidenced in the chart above).
Condos retained their value the best relative to other housing types, but even they continue to slide downward (this could be however due to a weak winter market for eg). Singles on the other hand have shed substantial value – about $200K down from their March 2017 peak.
Where will the housing market go from here? I think Spring 2018 will give us a clearer picture, as spring markets are usually very active housing markets. We were anticipating the fall 2017 market to give us an idea of where the market was heading, but it provided little information.
Here’s what the monthly resale levels look like for the last 6 years –

It appears that the resale housing market in the Toronto GTA is not really plummeting or recovering, just merely existing…and that’s not necessarily bad.
Two years ago I wrote articles (here and here) on why I don’t believe Toronto will suffer a housing crash. I still believe that. But I had greater confidence in the market when prices were rising by about 5 to 10% per year, as opposed to 34%.
The higher they rise, the harder they fall
I’m not sure who said the infamous quote from above, but I do know that a drop of 34% in values is much harder to swallow than a drop of 5%.
But the one thing I am very confident in is Toronto. This city is on a great trajectory and in 20 years time, it will be an even more amazing place than it is today. If you need proof, check this and this out. And the real question now is not what happens in 20 years, but what will happen in the next 5 to 10 years…
Full disclosure: I helped develop a number of the measures as part of Ontario’s Fair Housing Plan aimed at increasing housing supply, including actions related to Growth Plan implementation and monitoring the impact of the measures while with the Ministry of Municipal Affairs

3 comments